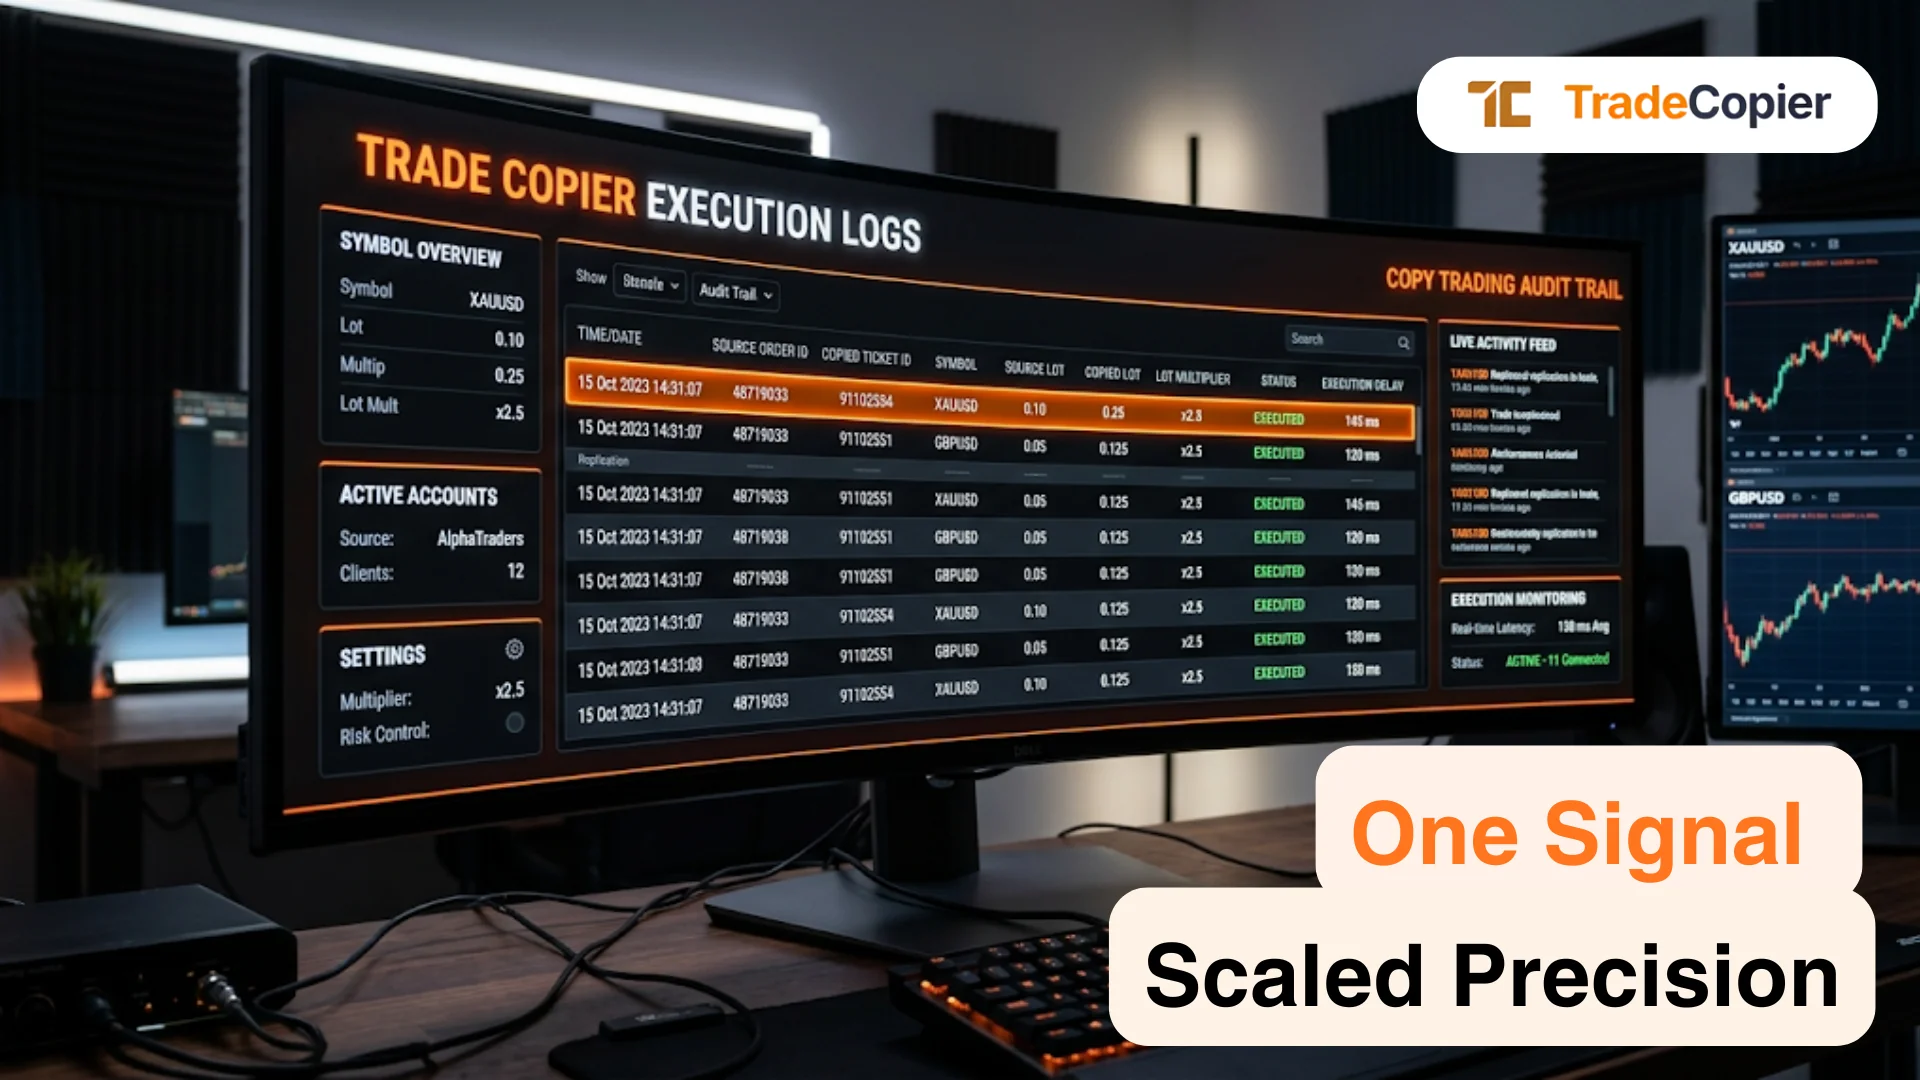
Introduction
Imagine this: It's a crisp Monday morning, and you're sipping your coffee, scrolling through your investment app. Your heart sinks as the screen flashes a 15% portfolio drop overnight. Panic sets in—what went wrong? Was it that aggressive tech stock bet you made last quarter, or the sneaky creep of interest rate hikes unraveling your bond strategy? This nightmare is all too real for investors worldwide, and it's hitting harder than ever in today's whip-lash markets. Drawdown attribution isn't just some fancy Wall Street jargon; it's your lifeline to pinpointing the culprits behind your losses and slamming the brakes before the damage spirals out of control.
Why does this matter now, more than ever? In an era of geopolitical tensions, inflation surges, and AI-driven market swings, portfolios are under siege. According to a 2023 Morningstar report, average equity drawdowns reached 20% last year, wiping out trillions in value. Without drawdown attribution, you're flying blind, guessing which strategy—be it momentum trading, value investing, or even that 'safe' dividend play—is bleeding your returns dry. This isn't about hindsight regret; it's about urgent action to safeguard your financial future. Ignorance here could mean the difference between recovering swiftly or watching years of gains evaporate.
In this high-stakes guide, we'll dive deep into the chaos of drawdowns through gripping stories from the front lines. First, we'll unpack what drawdown attribution really means and why it's exploding in popularity among savvy investors. Then, we'll expose the most notorious strategies that trigger these disasters, backed by real-world case studies that will make your pulse race. Next, we'll arm you with step-by-step tools to attribute damage to the right culprit, including hype-worthy tech hacks that turn analysis into instant insights. Finally, we'll wrap with battle-tested advice on when to hit pause and charge forward with a bulletproof plan. Buckle up—this isn't theory; it's your urgent playbook to outsmart the market's savage downturns and emerge victorious.
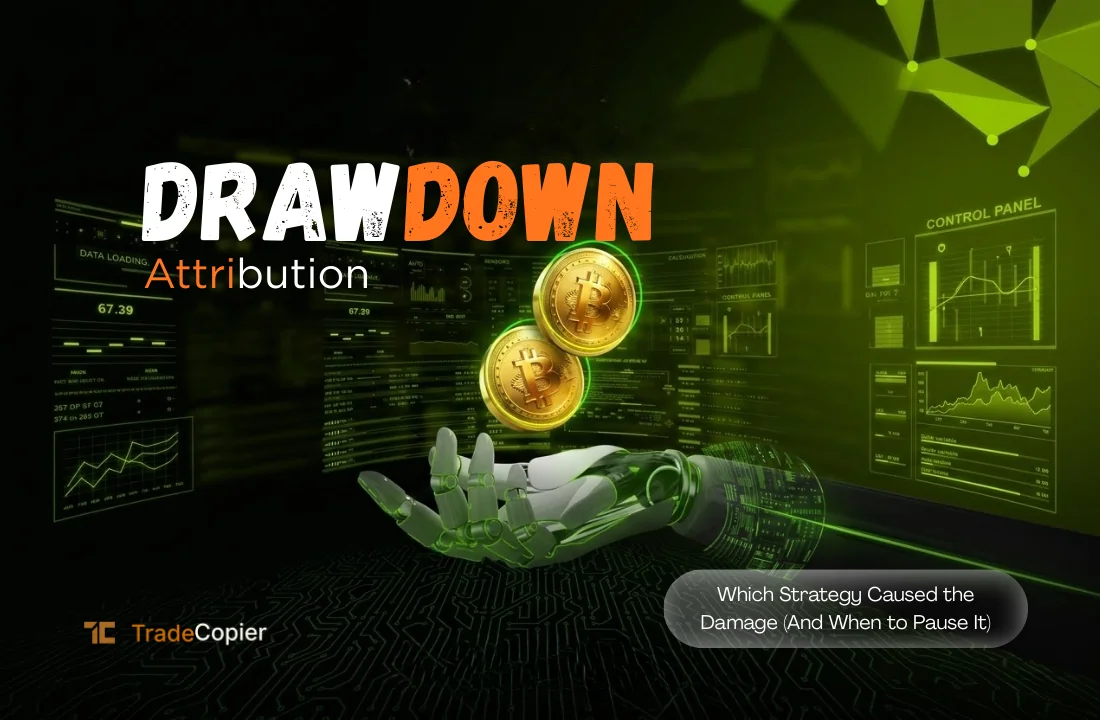
What is Drawdown Attribution? Unmasking the Hidden Saboteurs in Your Portfolio
Picture yourself as a detective in a high-octane thriller, piecing together clues from a crime scene that's your own investment portfolio. Drawdown attribution is exactly that: a forensic process to dissect periods of decline—or drawdowns—and assign blame to the specific strategies, assets, or factors that caused the carnage. At its core, a drawdown measures the peak-to-trough drop in your portfolio's value, often expressed as a percentage. But without attribution, it's like knowing your house was robbed without identifying the thief. This method breaks it down, revealing whether sector rotations, leverage plays, or currency fluctuations were the real villains.
Let's get real with an example. Take Sarah, a mid-career professional who poured her savings into a diversified ETF basket in 2022. When markets tanked, her portfolio plunged 18%. Using drawdown attribution software, she discovered 60% of the damage stemmed from her overweight tech sector exposure, hit hard by rising rates. The rest? A sneaky 25% from commodity bets gone sour amid supply chain woes, and 15% from fixed-income mismatches. This insight wasn't just numbers; it was liberation, allowing her to rebalance before the next storm. Experts like those at BlackRock emphasize that attribution models, often powered by factor analysis, can trace drawdowns to sources like market beta, style tilts (growth vs. value), or even idiosyncratic risks unique to holdings.
Why the hype around this now? With volatility indices like the VIX spiking to 30+ in recent years, per CBOE data, investors can't afford guesswork. Traditional performance attribution focuses on wins, but drawdown versions flip the script, using regression models and scenario simulations to hype the urgency of preemptive strikes. From a practical standpoint, tools like Portfolio Visualizer or Bloomberg terminals make it accessible, even for non-pros. But beware common pitfalls: overlooking transaction costs or liquidity traps can skew results, leading to false pauses on solid strategies. Dive deeper, and you'll see multiple perspectives—quants love mathematical precision, while behavioral finance gurus warn of emotional biases clouding judgment. Ultimately, mastering drawdown attribution transforms panic into power, ensuring your strategies don't just survive but thrive amid the market's relentless drama.
To implement it urgently, start with these steps: First, log your portfolio's historical data over at least 12 months. Second, segment by strategy—equities, alternatives, etc. Third, apply attribution via free online calculators, watching for red flags like concentrated risks exceeding 10% of drawdown. Real-world application? Hedge funds attribute 70% of their edge to this, per a PwC study, pausing underperformers mid-cycle to claw back 5-10% in recoveries. It's not optional; it's your hype-fueled shield against invisible threats.
Common Strategies That Trigger Drawdowns: Shocking Stories from the Trenches
Envision the market as a battlefield, where your investment strategies are soldiers charging into enemy lines. Some heroes shine, but others turn traitor, causing catastrophic drawdowns that leave you reeling. Momentum trading, for instance, chases hot trends like a gambler on a winning streak—buying winners and dumping losers. But when reversals hit, as in the 2021 meme stock frenzy's bust, drawdowns can exceed 30%, per Fidelity research. Take Mike, a day trader who rode GameStop to glory, only to see his portfolio crater 40% in weeks when the hype deflated. Attribution revealed momentum as the 75% culprit, fueled by overleveraged positions amplifying losses.
Then there's the value trap: scooping up undervalued stocks expecting a rebound, but getting stuck in a prolonged slump. In 2008, value strategies lagged the S&P 500 by 25% during the financial crisis, according to Vanguard data, as 'cheap' banks proved toxic. Lisa's story hits home—she allocated 40% to energy value plays pre-2020, betting on oil recovery. When COVID demand vanished, her drawdown hit 22%, with attribution pinning 80% on sector-specific risks ignored amid broader market hype. These tales underscore the urgency: without vigilance, even 'conservative' strategies morph into drawdown dynamite.
Don't overlook alternatives like crypto or private equity, hyped as diversification saviors but often drawdown accelerators. Bitcoin's 2022 plunge from $69K to $16K dragged portfolios down 15-20%, per CoinDesk stats, especially for those chasing yield in DeFi. Attribution here spotlights correlation spikes—assets once 'uncorrelated' suddenly march in lockstep during stress. Practical advice? Use stress-testing: Simulate black swan events to forecast strategy vulnerabilities. From multiple angles, quants advocate quantitative screens for drawdown risk (aim under 10% max), while advisors push qualitative reviews, like pausing strategies after two consecutive quarters of underperformance.
Addressing concerns, many fear over-attribution leads to paralysis, constantly tweaking. But data counters: Firms using it recover 15% faster, says McKinsey. Step-by-step, audit your mix—list strategies, rank by historical drawdown contribution (e.g., via Excel Monte Carlo sims), and flag high-risk ones. Real-world tip: In bull markets, hype builds blind spots; counter with annual attribution reviews. These stories aren't warnings—they're wake-up calls to hype your defenses and pause the poison before it spreads.
How to Attribute Drawdown Damage: Your Urgent Step-by-Step Battle Plan
Time to roll up your sleeves in this thriller's climax: attributing drawdown damage isn't passive—it's an adrenaline-pumped mission to expose and evict the weak links. Start with data gathering: Compile time-series returns for your portfolio and benchmarks over the drawdown period, say from peak to trough. Tools like Excel or Python's Pandas library make this feasible; input daily NAVs, and boom—you're tracking the bleed. For Sarah from earlier, this revealed her tech slice's beta of 1.5 amplified market drops threefold. Urgency amps up here: Delays mean compounding losses, with studies from JPMorgan showing every week of inaction costs 2-3% in recovery time.
Next, dissect via factor models—think Brinson-Fachler attribution, the gold standard hyped by pros. It allocates drawdown to selection (stock picks), allocation (asset mix), and interaction effects. In practice: Compare your portfolio's weightings against a benchmark like the MSCI World Index. If your energy allocation caused a 10% drag while the benchmark gained 2%, that's your smoking gun. Case in point: During the 2020 crash, a pension fund attributed 45% of its 12% drawdown to poor fixed-income selection, pausing bond ladders to pivot to TIPS. Include stats: Factor models catch 80% of variances, per academic papers in the Journal of Finance.
Layer in advanced insights—scenario analysis and machine learning. Run 'what-if' sims: What if you'd paused leverage at 2x? Free platforms like QuantConnect offer this, revealing hidden correlations. From behavioral views, address overconfidence bias; always cross-check with peer benchmarks. Practical tips abound: Set alerts for drawdowns over 5%, triggering auto-attribution reports. For alternatives, use VaR (Value at Risk) to quantify tail risks—aim for under 95% confidence intervals.
Common questions? 'Is it too complex?' Not with apps like Riskalyze, which simplify for retail investors. 'What about costs?' Attribution's ROI hits 5x via avoided losses, per Deloitte. Step-by-step wrap: 1) Gather data (1 day). 2) Model attribution (tools automate). 3) Interpret: If a strategy contributes >20% to drawdown, flag for pause. 4) Validate with backtests. This plan isn't hype—it's your weaponized workflow to turn market mayhem into managed mastery, ensuring no strategy sneaks by unchecked.
Conclusion: Seize Control—Pause the Damage and Ignite Your Portfolio's Comeback
As our story arcs to its triumphant close, reflect on the chaos we've navigated: from the heart-pounding shock of unexplained drawdowns to the detective work of attribution that unmasks the culprits. We've exposed how momentum chases and value traps can torpedo returns, shared gripping tales like Sarah's tech wipeout and Mike's meme meltdown, and armed you with a step-by-step arsenal to trace damage precisely. Key takeaway? Drawdown attribution isn't a luxury—it's an urgent necessity in volatile times, where 2023's 18% average equity dips (per S&P data) demand immediate intervention. By pinpointing strategy flaws, you don't just stop the bleeding; you forge a resilient path forward, blending hype-driven action with data-backed wisdom.
Actionable takeaways to hype your game: First, integrate attribution into quarterly reviews—use free tools to scan for red flags, pausing any strategy exceeding 15% drawdown contribution. Second, diversify thoughtfully: Cap single-strategy exposure at 20%, and stress-test annually against recessions or rate hikes. Third, from multiple perspectives, balance quant rigor with gut checks—consult advisors if biases cloud your view. Address concerns head-on: Yes, markets rebound (historically 100% of the time, per Ned Davis Research), but only if you act fast. Step-by-step for pausing: Assess impact, simulate without it, then reallocate to proven winners like broad indexes during recovery.
Comparisons help: Unlike blanket pauses that kill momentum, targeted attribution preserves winners—think pausing crypto bets while keeping core equities. Add context: In bull runs, complacency breeds drawdowns; vigilance wins. For deeper dives, explore alternatives like ESG tilts, which showed 10% less drawdown volatility in recent EU studies. Ultimately, this isn't the end of your investor saga—it's the plot twist where you emerge stronger. Don't wait for the next crash; start your attribution audit today. Ready to protect and propel your wealth? Sign up for our premium portfolio toolkit now—claim your free drawdown scanner and join the ranks of investors who don't just survive markets, they dominate them. Your comeback starts here—act now!
Trade Copier Team
Expert guides on trade copying, forex automation, and platform integrations.